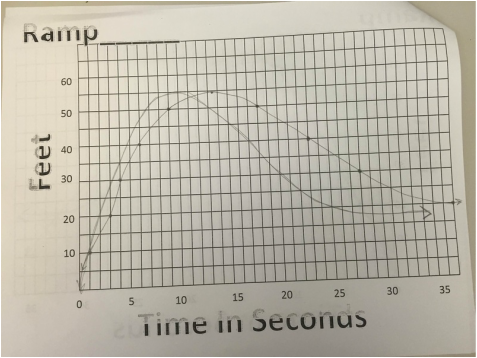
 Most of my predictions were close to the actual graph. My prediction and the actual graph was different because I have to guess the points quickly. The zeros of my graph represent the starting and ending pints. The zeros are when the skateboard is not moving. | 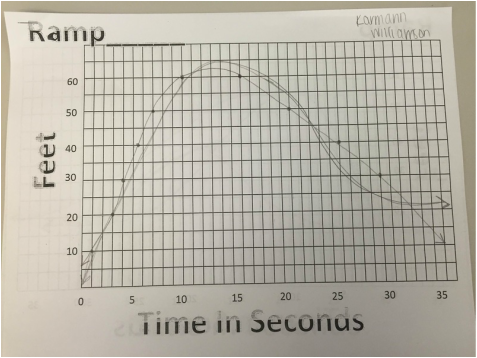 The graphs got smaller the smaller the ramp got. The skateboard couldn't get as much distance on the little ramp as it could on the bigger one. When the graph rises fast is means the skateboard is going faster. When it is falling fast it means that it is coming back faster. | 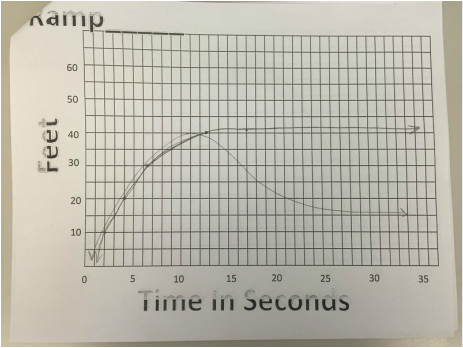 |
 RSS Feed
